Learn how to calculate binomial distribution confidence intervals using step-by-step methods, formulas, and examples. Ideal for students and data analysis learners.
Why Binomial Confidence Intervals Matter
In probability and statistics, understanding how to calculate a binomial distribution confidence interval is crucial for students, analysts, and researchers. Whether you’re studying for an exam or conducting a survey, confidence intervals help estimate the true population proportion from your sample results.
For example, if you surveyed 100 people and 56 agreed with a statement, how sure are you that this result reflects the entire population? The answer lies in binomial confidence intervals—a statistical method used to estimate this range of values with a certain level of confidence, such as 95%.
This guide explains the concept, formulas, calculation methods, examples, and related tools for binomial confidence intervals, including their application in real-world problems.

What is a Binomial Distribution Confidence Interval?
A binomial distribution confidence interval is a statistical range used to estimate the true proportion of success in a binomial experiment. A binomial experiment is a situation with only two outcomes: success or failure, such as:
- Passing or failing an exam
- Clicking or not clicking an online ad
- Voting for or against a proposal
The interval tells us where the actual population proportion likely falls, based on the observed sample proportion.
Key Purpose:
To quantify uncertainty and determine how reliable your sample estimate is for the entire population.
When to Use Binomial Confidence Intervals
You should apply a binomial confidence interval when:
- The outcome of your experiment has only two possibilities.
- You want to estimate a proportion or probability from sample data.
- You need to provide a margin of error for your results.
Common Use Cases:
- Polling results in elections
- Estimating failure rates in quality control
- Predicting pass rates for exams
- Survey analysis for marketing or feedback
Terminologies to Understand
| Term | Meaning |
| n | Number of trials or sample size |
| x | Number of successful outcomes |
| p̂ | Sample proportion = x / n |
| z | Z-score (depends on confidence level) |
| CI | Confidence interval |
How to Calculate Binomial Distribution Confidence Interval
Step 1: Find the Sample Proportion
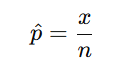
This gives the observed success rate.
Step 2: Choose a Confidence Level
Typically:
- 90% → Z = 1.645
- 95% → Z = 1.96
- 99% → Z = 2.576
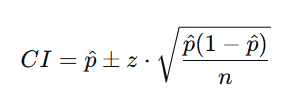
Step 3: Apply the Confidence Interval Formula
The approximate (normal) method:
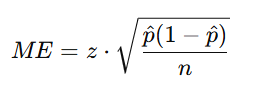
Step 4: Calculate the Margin of Error
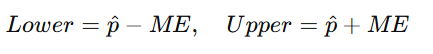
Step 5: Find the Lower and Upper Limits
Real Example: Binomial Confidence Interval Calculation
Question: In a test of 100 students, 56 passed. What is the 95% confidence interval for the true proportion of students who would pass?
Solution:
- n = 100, x = 56
- p^=56/100=0.56
- Z for 95% = 1.96
Now, calculate the margin of error:
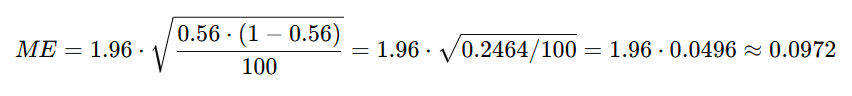
Confidence Interval:
CI=0.56±0.0972=[0.4628,0.6572]
Interpretation:
We are 95% confident that the true proportion of students passing lies between 46.28% and 65.72%.
Confidence Interval Table for Binomial Distribution (Z-scores)
| Confidence Level | Z-score |
|---|---|
| 90% | 1.645 |
| 95% | 1.960 |
| 99% | 2.576 |
This table helps you select the correct Z-score based on your desired confidence level.
Using Binomial Confidence Interval Calculator
You can avoid manual calculations by using free online calculators. These tools only require:
- Total number of trials (n)
- Number of successes (x)
- Confidence level (e.g., 95%)
Popular options:
- Statology.org Binomial Confidence Interval Calculator
- GraphPad QuickCalcs
- SocSciStatistics Binomial Proportion CI Calculator
These are ideal for students looking to check their answers or do quick calculations.
Exact Binomial Confidence Interval
When the sample size is small (n < 30), the exact binomial method (Clopper-Pearson interval) is more accurate than the normal approximation.
Formula:
Involves using cumulative binomial distribution functions and inverse beta distribution—typically solved using statistical software like R or Python.
Use case:
Useful when data is sparse or when normal approximation conditions are not met.
Negative Binomial Distribution Confidence Interval
Unlike binomial distribution, which counts the number of successes in fixed trials, negative binomial distribution models the number of failures before a set number of successes.
Its confidence interval can be calculated using more complex methods, such as:
- Likelihood estimation
- Bayesian inference
- Chi-square based approximation
Often used in:
- Quality assurance
- Insurance claims modeling
- Healthcare and rare event data analysis
Frequently Asked Questions (FAQs)
What is the minimum sample size to use normal approximation?
If both np ≥ 5 and n(1 – p) ≥ 5, then the normal approximation is considered valid.
How to calculate binomial confidence interval in Excel?
Use Excel’s =CONFIDENCE.NORM(alpha, standard_dev, size) or =NORM.S.INV functions for calculations.
What’s the difference between exact and normal confidence intervals?
Normal approximation is easier but less accurate for small samples, while the exact method is more reliable in those cases.
Conclusion
Mastering the binomial distribution confidence interval allows you to make statistically sound estimates for population proportions. Whether you’re analyzing survey data, exam results, or experimental outcomes, understanding how to calculate and interpret confidence intervals adds great value to your data analysis skills.
By using this step-by-step method, formulas, examples, and calculators, students and researchers can confidently work with binomial proportions in academic and professional settings.
Disclaimer
This content is for educational purposes only. For detailed statistical analysis or professional use, consult a certified statistician or data scientist.