Learn how to use the binomial probability table in 5 easy steps. Includes examples, formulas, PDF tips, and student-friendly guidance.
Why Binomial Probability Tables Matter
If you’re a student preparing for exams in statistics, probability, or data science, understanding the binomial probability table is a must. Whether you’re solving MCQs in competitive exams or interpreting real-world probabilities in class, this table saves time and simplifies complex calculations.
But how do you use it properly? This blog post offers a step-by-step binomial probability table explanation with examples, charts, and formulas. Let’s decode this powerful statistical tool in the simplest way possible.

What is a Binomial Probability Table?
A binomial probability table is a reference chart that displays the probability of getting exactly x successes in n independent trials of a binomial experiment. It helps calculate probabilities without manually using the binomial formula every time.
Formula Behind the Table
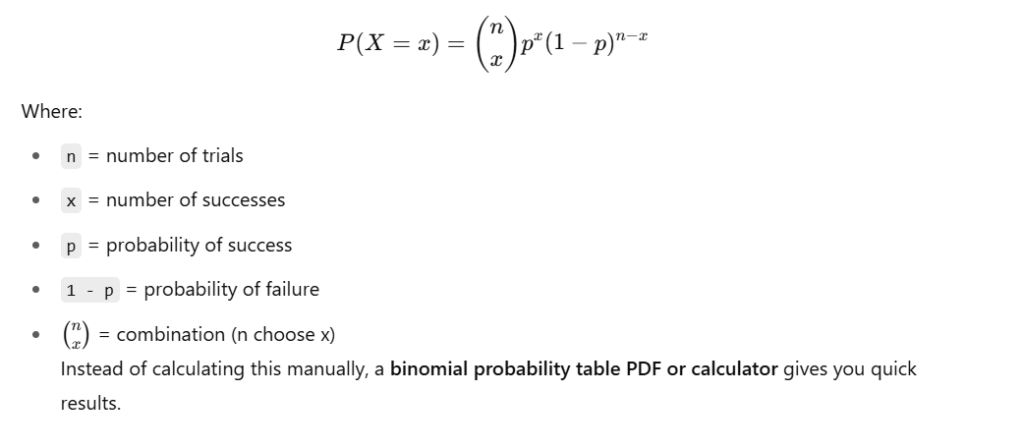
The binomial probability formula is:
How to Use a Binomial Probability Table
Step 1: Identify n, x, and p
Start with your problem statement. Determine:
n: Number of trials (e.g., flipping a coin 10 times)x: Desired number of successesp: Probability of success in one trial
Step 2: Locate the Right Table
You need a binomial probability table for the correct value of n. Example: Use binomial probability table n=15 if your trial count is 15.
Step 3: Match Probability p
Choose the column that matches the given probability of success, p. Tables usually include values like 0.1, 0.2, …, 0.9.
Step 4: Find Row for Value x
Move down the table to the row corresponding to the desired x (number of successes).
Step 5: Read the Probability
The cell where your selected p column and x row intersect gives the probability value.
Example: Using a Binomial Probability Table (n = 5)
Let’s say:
- You toss a coin 5 times (
n = 5) - You want the probability of getting exactly 3 heads (
x = 3) - Probability of heads in one toss = 0.5 (
p = 0.5)
Table Snippet for n = 5, p = 0.5
| x (Successes) | P(X = x) |
|---|---|
| 0 | 0.03125 |
| 1 | 0.15625 |
| 2 | 0.31250 |
| 3 | 0.31250 |
| 4 | 0.15625 |
| 5 | 0.03125 |
So, P(X = 3) = 0.3125. That’s your answer—just by reading the table.
Understanding the Cumulative Binomial Probability Table
A cumulative binomial probability table shows:
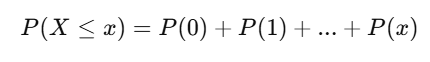
It gives the total probability of getting up to x successes, which is useful in hypothesis testing or determining probability ranges.
How to Use Cumulative Binomial Probability Table
- Find the row for desired
x - Look under the cumulative column for
p - Get total probability from 0 to
x
For example:
If cumulative P(X ≤ 3) = 0.8125, it means there’s an 81.25% chance of getting 3 or fewer successes.
Binomial Probability Table Interpretation
Use it to:
- Predict probabilities in experiments (like coin tosses or quality checks)
- Evaluate binomial distributions for hypothesis testing
- Solve exam questions faster without lengthy calculations
Tip: Always check if the scenario fits a binomial model:
- Fixed number of trials (
n) - Two outcomes (success/failure)
- Independent trials
- Same probability
pfor each trial
FAQ: Binomial Probability Table Basics
-
What is a binomial probability table used for?
It helps you quickly find the probability of getting a specific number of successes in a fixed number of trials without doing complex calculations.
-
Can I create a binomial table on a calculator?
Yes. Calculators like the TI-84 have built-in functions for binomial distributions:
binompdf(n, p, x)andbinomcdf(n, p, x). -
What’s the difference between binomial and cumulative binomial tables?
A regular table shows P(X = x). A cumulative one shows P(X ≤ x) — the total probability of
xor fewer successes.
Conclusion: Make Statistics Simpler with Binomial Tables
Whether you’re preparing for school exams, competitive tests, or practical applications, a binomial probability table can save you time and boost accuracy. Understanding how to read and use the table is essential for mastering statistics.
With step-by-step examples, Excel tips, and calculator methods, now you’re equipped to use this statistical tool confidently.
Keep practicing and you’ll master probability in no time.
Disclaimer
This post is for educational purposes only and should not be used as a substitute for academic instruction or professional advice.